PaleoFlow App
PaleoFlow.org
Streamflow Reconstructions
Posted by Jim Stagge on March 15, 2018
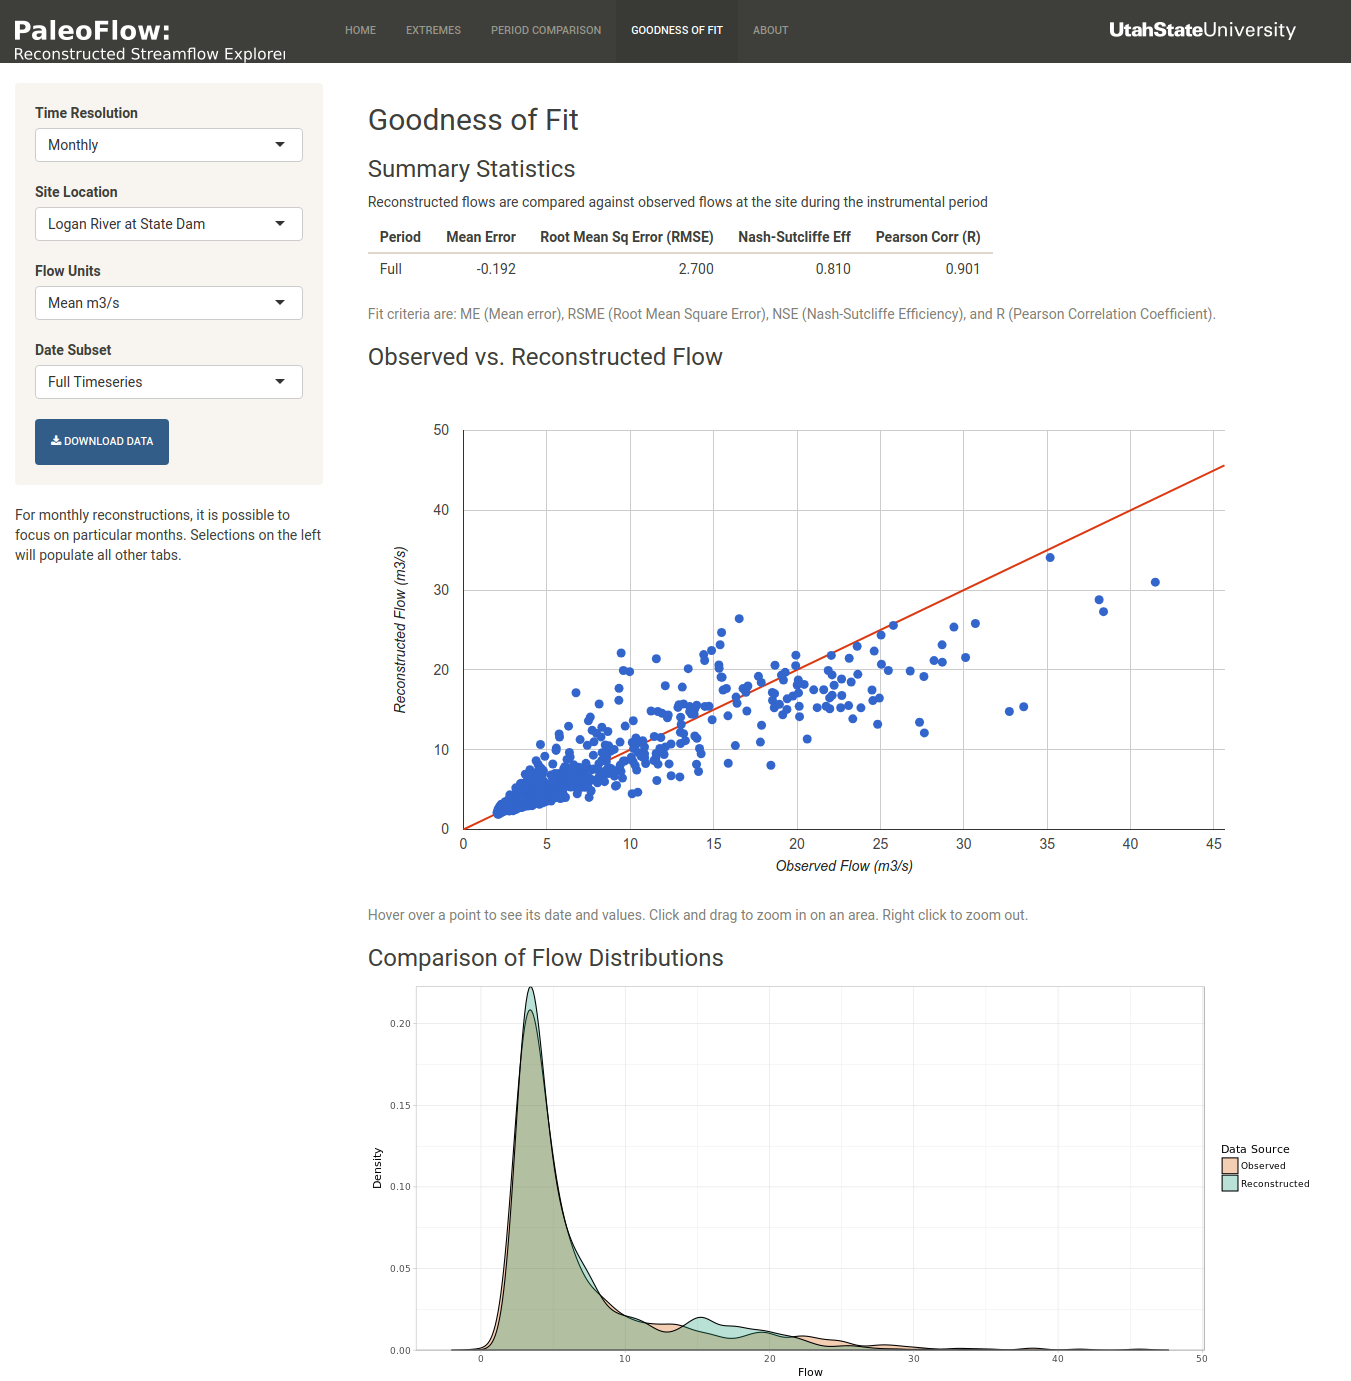
I have published a new online application to improve public access to streamflow reconstruction data. You can find it at www.paleoflow.org. The site allows users to visualize reconstructed flows over multiple centuries and interact with the series by zooming in on specific periods. It also allows users to find extreme flows below/above a threshold, easily compare any two historical periods, and visualize the goodness of fit, relative to observed flows.
The site currently includes 3 monthly reconstructions and > 100 annual reconstructions (with more being added). A paper explaining this tool is currently in review.
If you would like to contribute new data or add your time series to the visualization, please email at james.stagge@usu.edu.
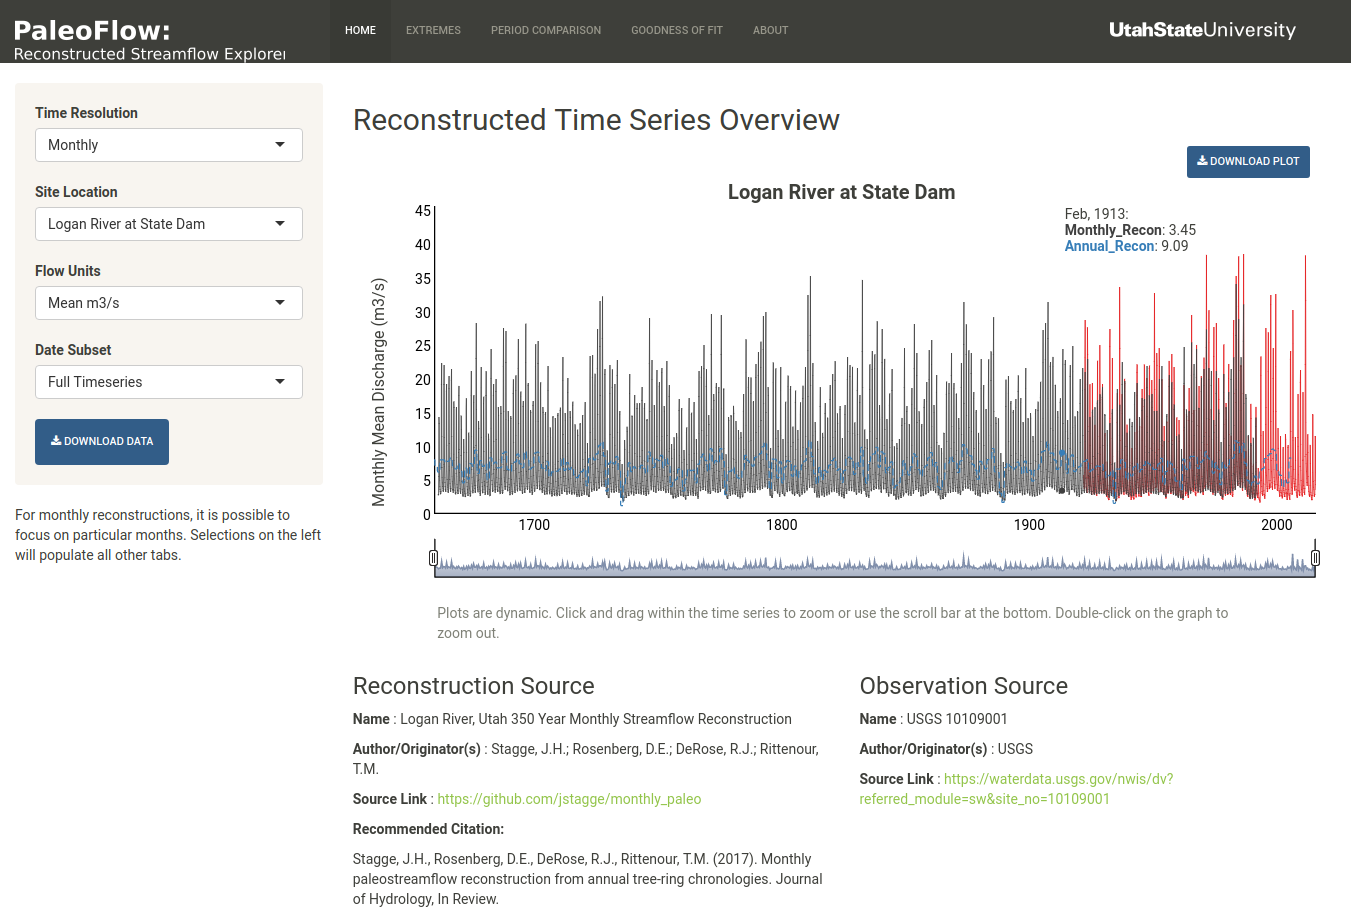
Screenshot showing an example monthly flow reconstruction.
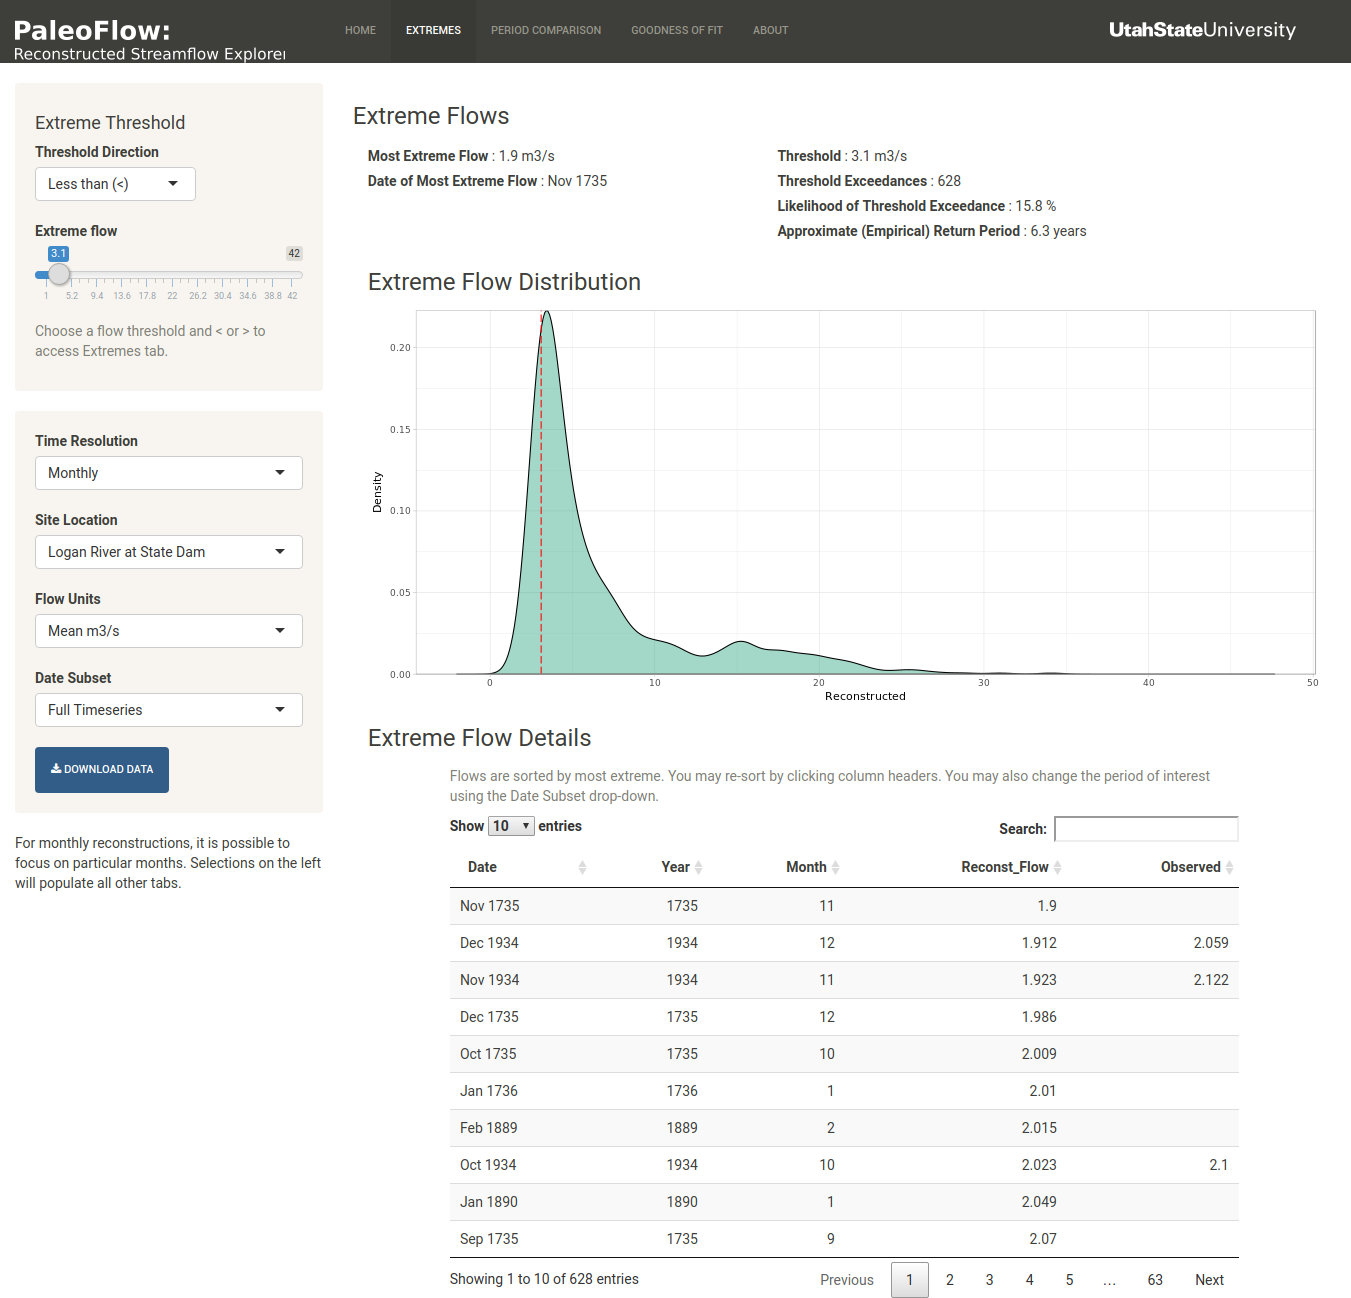
Screenshot showing the Extreme Flow tab.
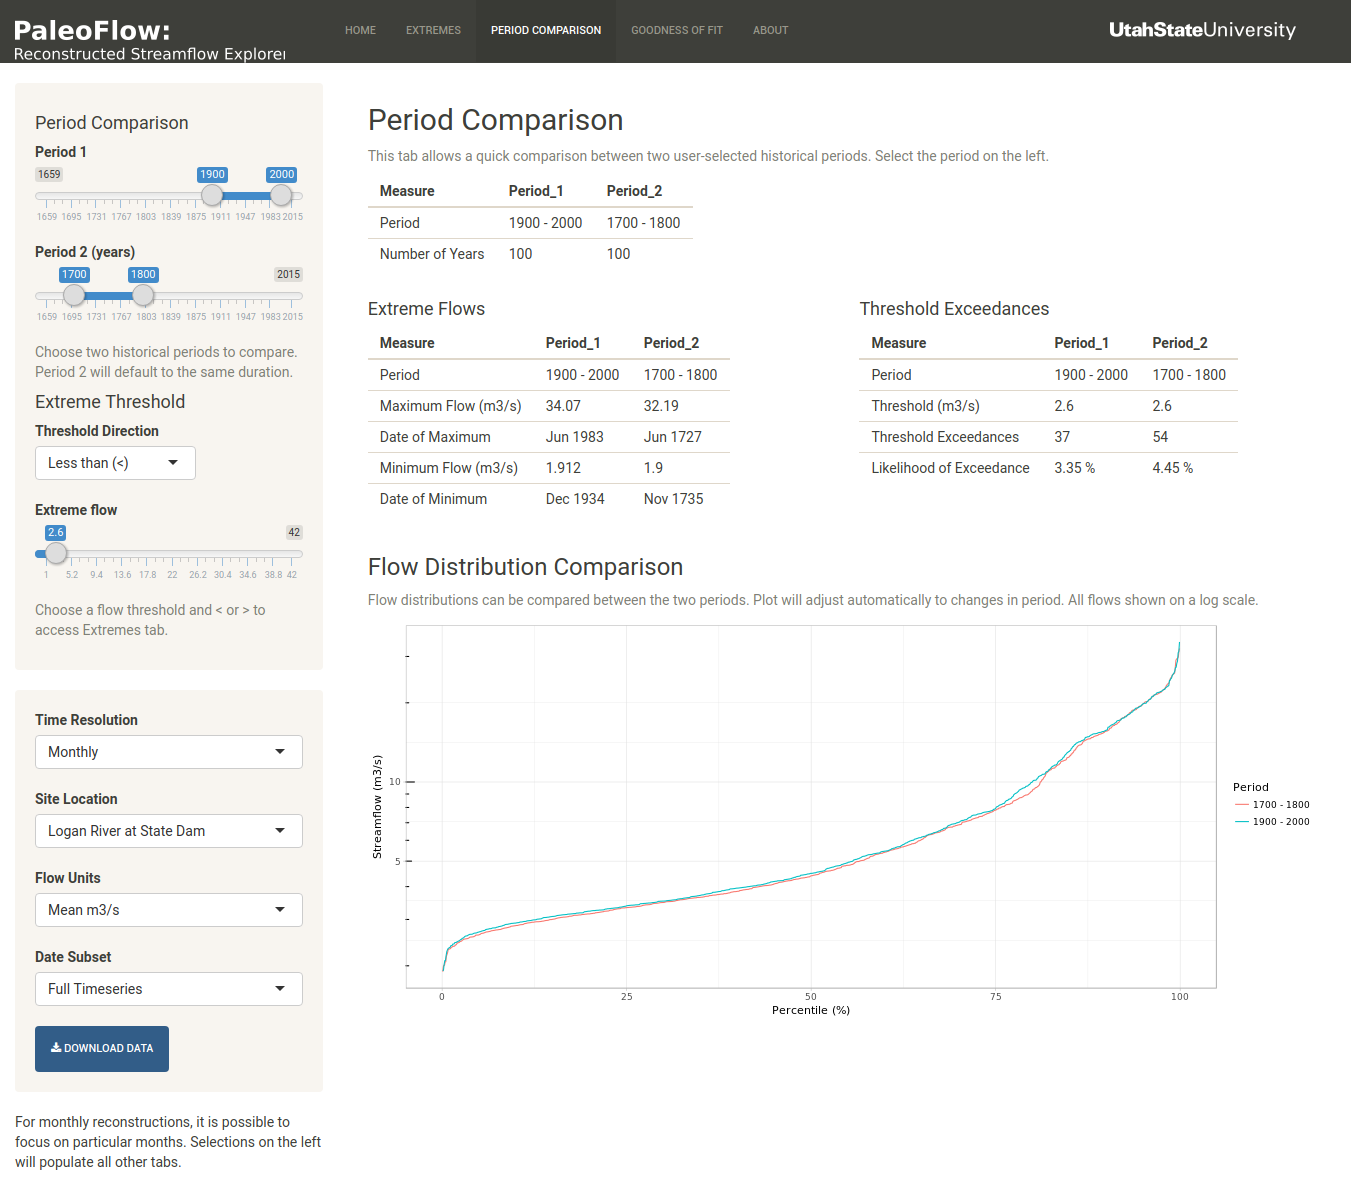
Screenshot showing the Period Comparison tab.