
Pair of Papers Published
A Summary of the 2015 European Drought
A Summary of the 2015 European Drought
Posted by Jim Stagge on July 30, 2016
A pair of papers have recently been published, summarizing the 2015 European drought event from the perspective of climate and hydrology. This was a huge effort to compile as much data as possible about this event, spurred on by the recommendation that hydrology should be considered alongside atmospheric conditions. Because streamflow data tends to be more fractured nationally than global atmospheric observations, the hydrologic perspective often is not available for publication until much later. A considerable effort was made by a considerable number of co-authors to provide this data in a timely fashion and describe the 2015 drought event.
You can find both papers here (open access) :
Ionita, M., Tallaksen, L.M., Kingston, D., Stagge, J.H., Laaha, G., Van Lanen, H.A.J., Chelcea, S.M., Haslinger, K. (2016) "The European 2015 drought from a climatological perspective" Hydrology and Earth System Sciences Discussions, 10.5194/hess-2016-218.
Laaha, G., et al. (2016) "The European 2015 drought from a hydrological perspective" Hydrology and Earth System Sciences Discussions, 10.5194/hess-2016-366.
Climatological Perspective
These companion papers begin with the climatological perspective, including the origin of the 2015 drought, its spatial and temporal development, and how it compares with the 2003 drought event. The summer drought of 2015 affected a large portion of continental Europe and was one of the most severe droughts in the region since summer 2003. The summer was characterized by exceptionally high temperatures in many parts of central and eastern Europe, with daily maximum temperatures 2 °C warmer than the seasonal mean (1971–2000) over most of western Europe, and more than 3 °C warmer in the east.
Similar to the summer drought of 2003, the upper level atmospheric circulation over Europe was characterized by a positive 500 hPa geopotential height anomalies flanked by a large negative anomaly to the north and west (i.e. over the central North Atlantic Ocean extending to northern Fennoscandia) and another center of positive geopotential height anomalies over Greenland and northern Canada. Simultaneously, the summer SST was characterized by large negative anomalies in the central North Atlantic Ocean and large positive anomalies in the Mediterranean basin. The SST dipole-like anomalies between the central Atlantic and the Mediterranean Sea suggest a possible “atmospheric teleconnection” between the two regions, which in turn may affect the drought conditions over Europe.
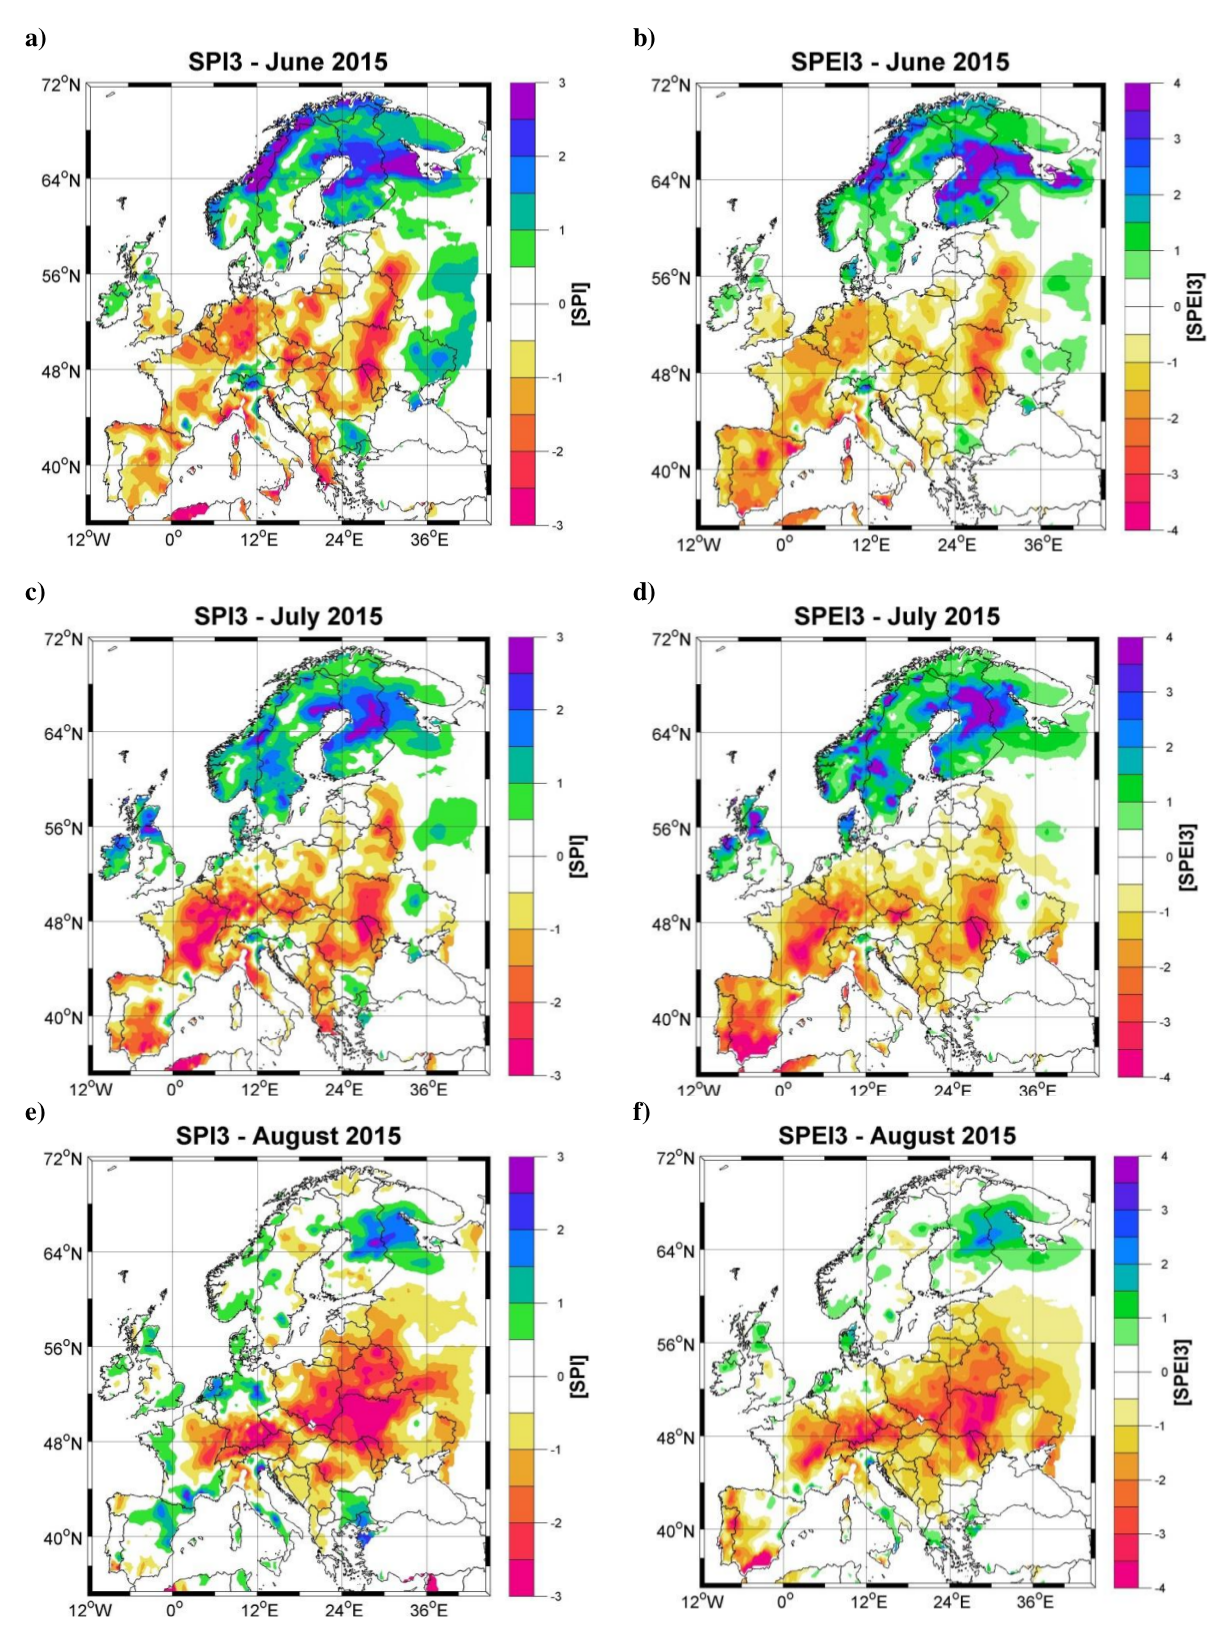
Fig. 3. Reproduced from article.. a) SPEI3 for June 2015; b) SPI3 for June 2015; c) as in a) but for July 2015; d) as in b) but for July 2015; e) as in a) but for August 2015 and f) as in b) but for August 2015. Reference period 1971-2000
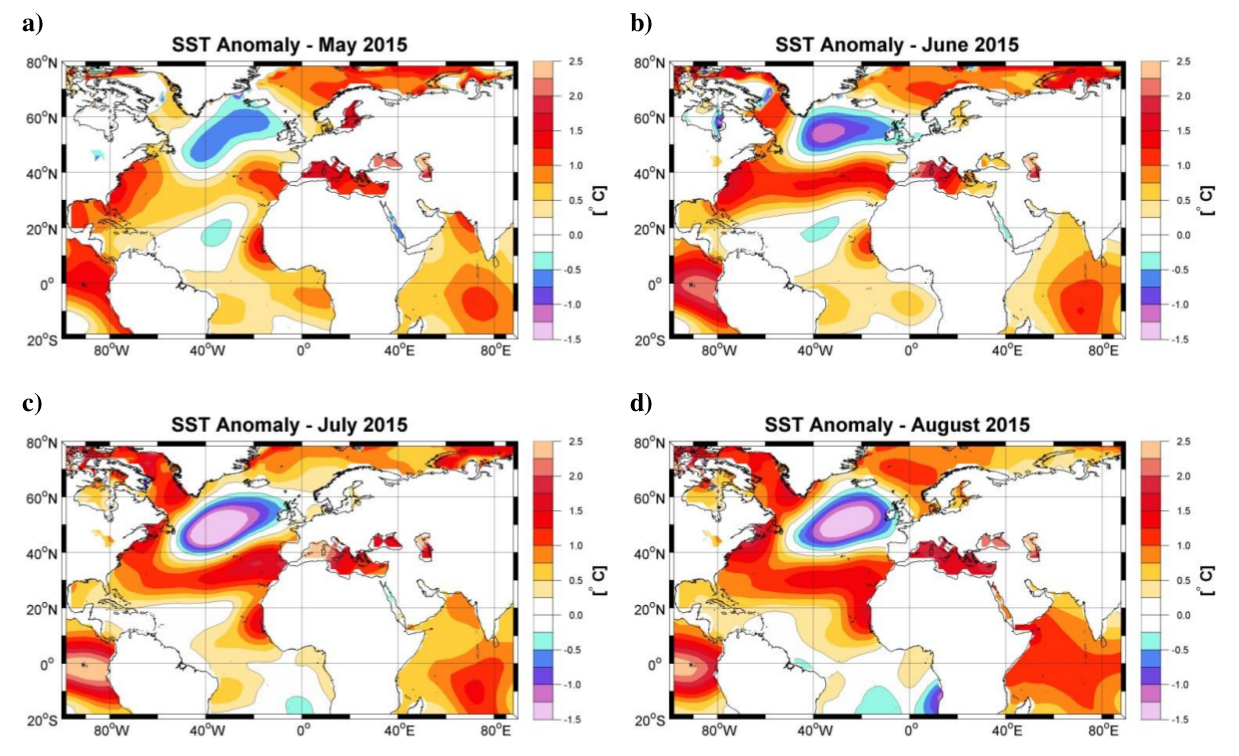
Fig. 4. Reproduced from article.. Monthly SST anomalies: a) May 2015; b) June 2015; c) July 2015 and d) August 2015. The anomalies are computed relative to the period 1971 – 2000
Hydrological Perspective
The second paper focused on the hydrological perspective of this event, analyzing roughly 800 streamflow records across Europe relative to the previous 2003 drought event.
In terms of low flow magnitude, a region around the Czech Republic was most affected with annual low flows that exhibited return intervals of 100 years and more. In terms of deficit volumes, the geographical centre of the event was in the area of Southern Germany where the drought lasted particularly long. A detailed assessment at various spatial and temporal scales showed that the different behaviour in these regions was also a result of diverging wetness preconditions in the catchments. Extreme droughts emerged where antecedent conditions were particularly dry.
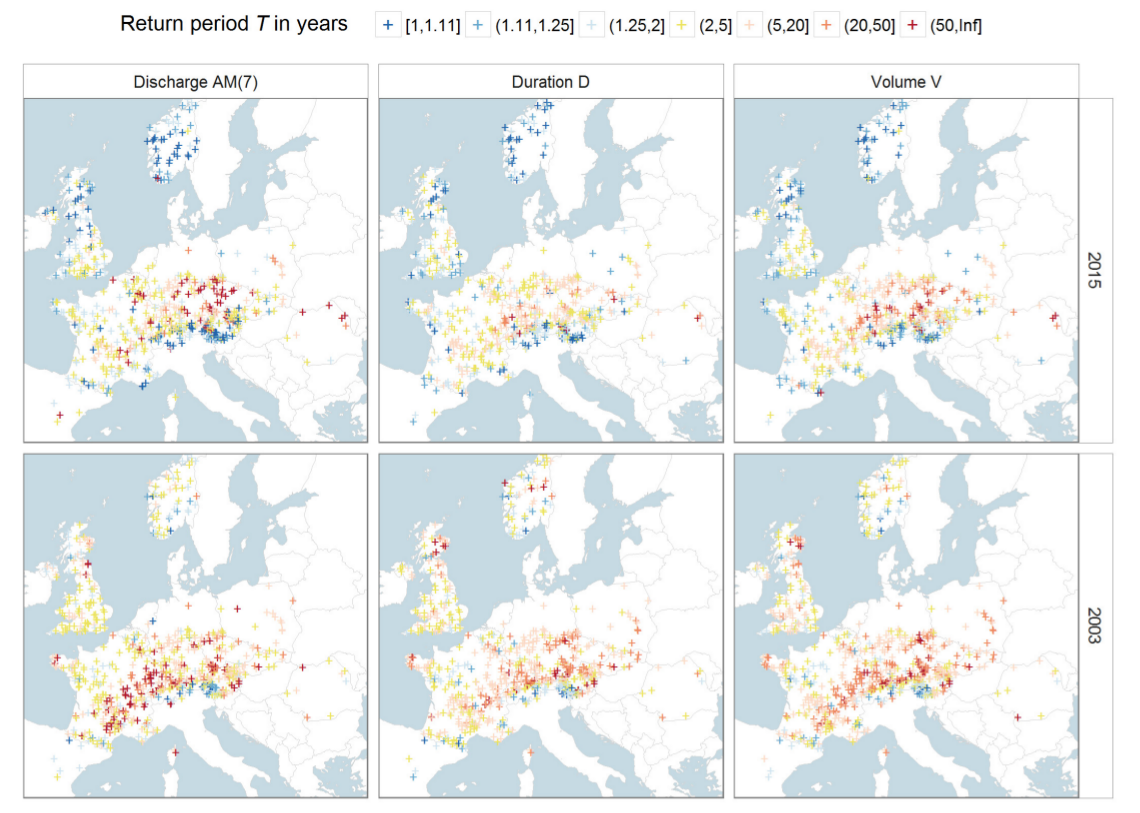
Fig. 1. Reproduced from article.. Return periods T (in yrs.) of annual low flow discharge AM(7) (left), duration D (centre) and deficit volume V (right panels) for the events of 2015 and 2003. Low flows and drought conditions below average conditions (return period > 2 years) are indicated by yellow to reddish colours. Severe events (return periods (20,50] and (50,Inf] yrs.) are indicated by orange and 5 red colours.